Soccer Spatial Analysis
Academic Project: 5 European Leagues
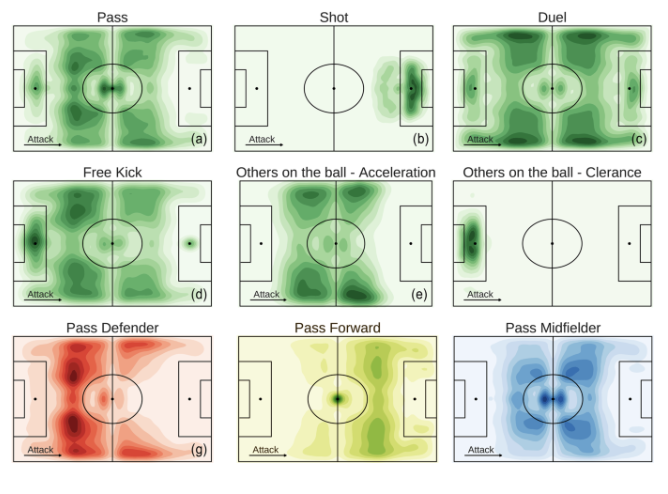
Built 100+ animated graphs displaying passing tendencies, key passes and assists, and position zones for every match in five major European leagues in 2018.
RggsoccergganimateWyscout
View project →